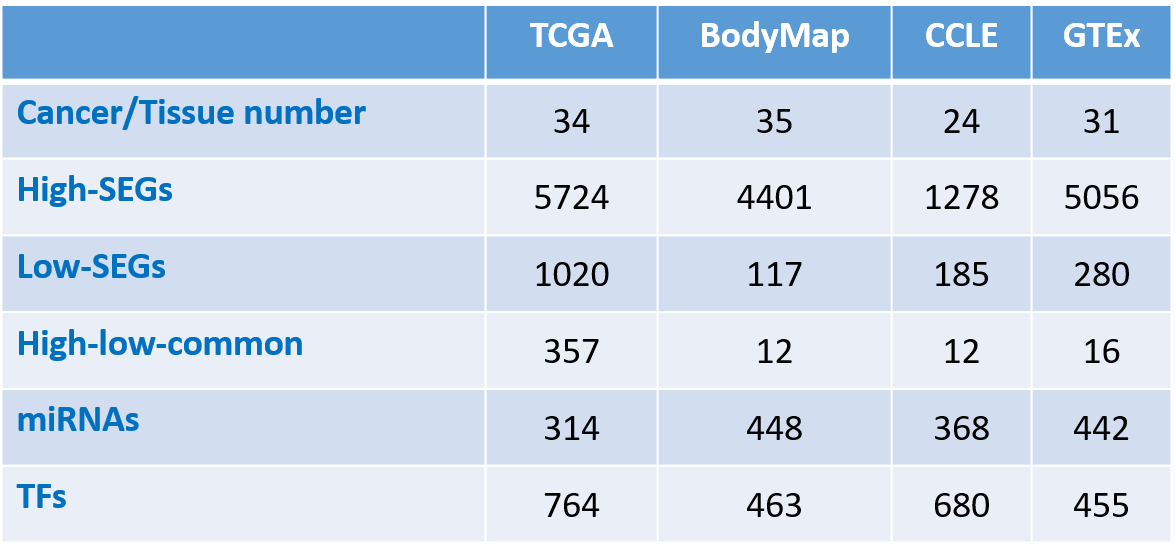

Table 1. SEGs of each cancer in TCGA dataset.

Figure 1. The total, high, low and overlap of high and low SEG number in TCGA dataset.

Figure 2. SEG number of different cancer types in TCGA dataset . The blue and red color in the column indicate the highly and lowly expressed SEGs in the cancer respectively, while the black and orange color indicate the genes also highly or lowly expressed in the other cancers.

Figure 3. The number of recurrently emerged SEGs in TCGA dataset. Some genes are specifically expressed in more than one cancer.

Figure 4. The total, high, low and overlap of high and low SEG number in BodyMap dataset.

Figure 5. SEG number of different tissues in BodyMap dataset. The blue and red color in the column indicate the highly and lowly expressed SEGs in the tissue respectively, while the black and orange color indicate the genes also highly or lowly expressed in the other tissues.

Figure 6. The number of recurrently emerged SEGs in BodyMap dataset. Some genes are specifically expressed in more than one tissue.

Figure 7. The total, high, low and overlap of high and low SEG number in CCLE dataset.

Figure 8. SEG number of different tissues in CCLE dataset. The blue and red color in the column indicate the highly and lowly expressed SEGs in the tissue respectively, while the black and orange color indicate the genes also highly or lowly expressed in the other tissues.

Figure 9. The number of recurrently emerged SEGs in CCLE dataset. Some genes are specifically expressed in more than one tissue.

Figure 10. The total, high, low and overlap of high and low SEG number in GTEx dataset.

Figure 11. SEG number of different tissues in GTEx dataset. The blue and red color in the column indicate the highly and lowly expressed SEGs in the tissue respectively, while the black and orange color indicate the genes also highly or lowly expressed in the other tissues.

Figure 12. The number of recurrently emerged SEGs in GTEx dataset. Many genes are specifically expressed in more than one tissue.
Previous
Next


