editingLogo
Dataset & Browse
  • We built SEGreg database by identifying SEGs from high-throughput data of TCGA, BodyMap, CCLE and GTEx database, along with the corresponding miRNA and TF regulations collected from several databases.
  • By clicking the buttons in navigation bar of homepage, users can browse SEGs (Specifically expressed genes) by cancer types or tissues or regulators, as well as download datasets, search and get the statistical data.
  • By clicking the figures or names of datasets in "SEG list" panel, users can browse all specifically expressed genes in relative database.
  • By clicking bar charts in "Tissue/Cancer" panel, users will see the barplot of highly/lowly expressed genes in different cancer types of TCGA or different tissues of other three datasets, and users can see detailed information of those genes by clicking pillars in the graph.
  • In the "Synergistic Regulation" panel, users can build their own regulatory network by choosing data source and tissue/cancer type, as well as inputing miRNAs and TFs in the input boxes, by clicking the "Submit" button, the regulatory network will show in a new page.
SEGs

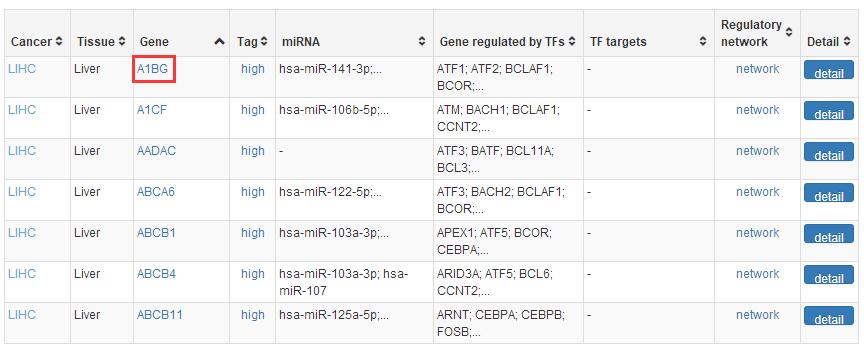
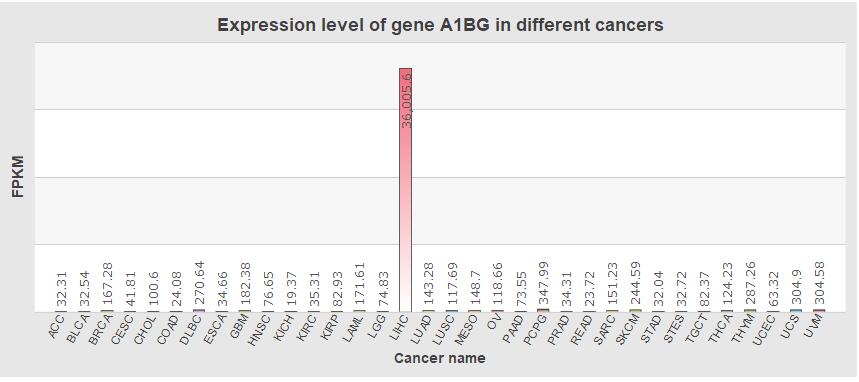
In SEGreg, SEGs is identified by SEGtool, which based on Fuzzy c-means, Jaccard index and greedy annealing method and outerperform the existing tools. Browse by tissues or genes as mentioned above, users will get the informations of SEGs presented in table format, in which there is a column named "Tag", by clicking the content in this column, users will see highly/lowly expressions of that gene in various cancer types/tissues. For example, gene A1BG highly expressed in LIHC, click the tag column of it,you will see expressions of it in different cancers, like the figure shown in below:

Regulation

In SEGreg, we provided two types of regulations: miRNA-gene and TF-gene. There are several ways for users to browse regulation information:

  • You can choose to browse miRNA regulation or TF regulation by clicking the "Regulation" title in the navigation bar of homepage.
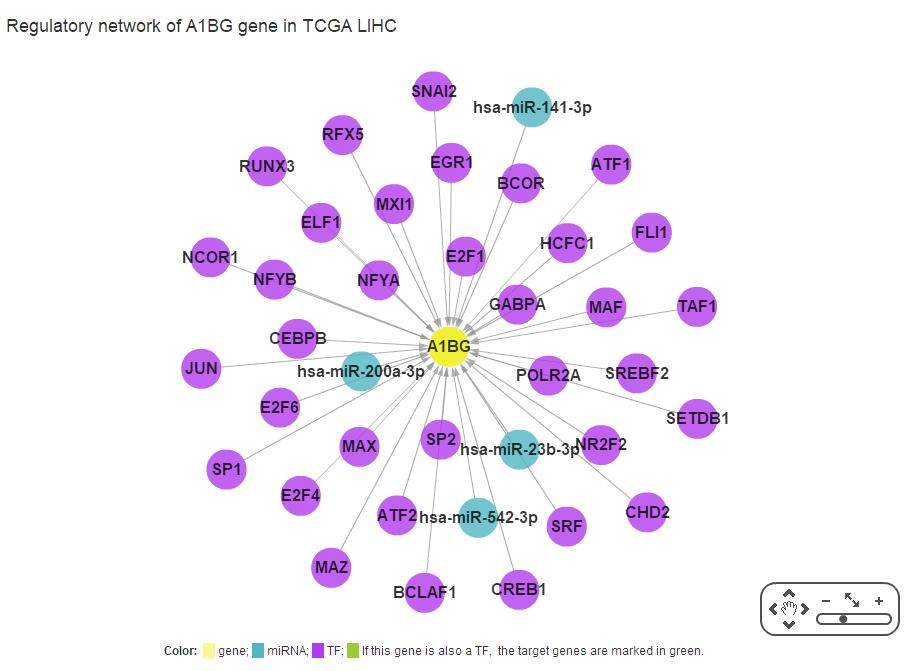
  • On the result display page as we mentioned in "SEGs" section above, there is a column named "Regulatory network", by clicking the contend of this column, you will see the regulation relationship between miRNA and gene or TF and gene. The figure below is a regulatory network of gene A1BG which mentioned above:
  • You can build regulatory networks using your interested miRNA and TF at the "Synergistic Regulation" panel on home page as we mentioned in "Dataset & Browse" section.
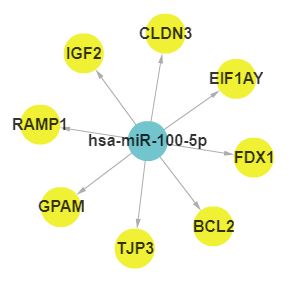
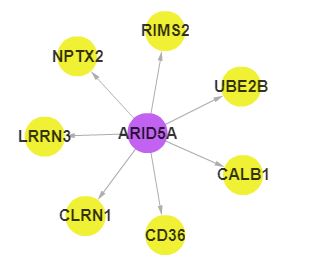
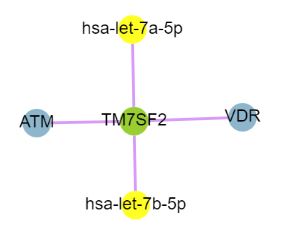
  • Here are several examples:

miRNA:gene regulation
TF:gene regulation
custom regulation
Contact us

An-Yuan Guo, Ph.D. Professor of Bioinformatics

Email:

Qin Tang, Ph.D.

Email: